








Shoppers browse on their phones, discover products on TikTok and Instagram, and increasingly complete purchases without ever visiting a brand’s website. Mobile and social commerce already account for the majority of ecommerce traffic and a growing share of revenue. For many categories, the phone is the primary storefront and social platforms are the leading discovery channel.
Yet most merchants’ product data tells a different story. Catalogs are still structured for desktop browsing and Google Shopping, with titles, images, and attribute fields optimized to meet a single platform’s requirements. The result is a growing mismatch between where consumers spend their time and money and where brands have invested in their product data. That mismatch costs real revenue, and the data on conversion rates and order values puts a number on exactly how much.
This is the first post in our Connected Commerce Growth series. We’ll start with the data on where shoppers actually spend their time and money, look at how different generations choose different channels, and explore why most product catalogs aren’t keeping up. Along the way, we’ll share practical steps you can take to turn all that mobile and social traffic into actual sales.
Where shoppers actually spend their time and money
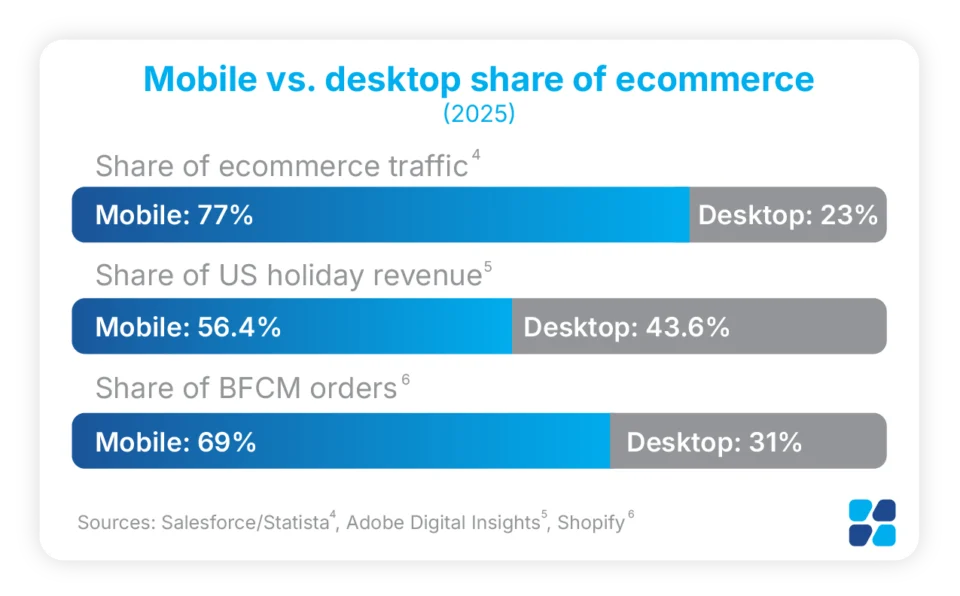
Mobile devices now account for roughly 77% of all retail ecommerce traffic, and the revenue is catching up.1 According to Adobe Digital Insights, 2025 was the first full year that mobile exceeded 50% of total US online spend, with mobile’s revenue share hitting a record 56.4% during the holiday season.2 Shopify saw the same pattern during Black Friday Cyber Monday, with 76% of traffic and 69% of orders coming from phones across its merchant base.3
Michael Longauer
Social commerce is growing even faster. eMarketer projects that US social commerce sales will surpass $100 billion in 2026, growing 18% year-over-year.7 TikTok Shop is driving much of that growth, forecast to generate $23.4 billion in US sales this year, a 48% increase that gives it a larger US ecommerce footprint than Target, Costco, or Best Buy.8 The platform’s global gross merchandise volume nearly doubled in a single year, reaching $64.3 billion in 2025.9 TikTok Shop also converts at roughly double the rate of Instagram and Facebook shopping features, averaging 3.4% compared to 1.8-2.1% on Meta’s platforms.10 11
Merchants who aren’t selling on social channels today are sitting out a $100 billion market that is adding roughly $15 billion in new spending each year. The longer they wait, the harder it becomes to build the audience, reviews, and seller reputation that drive visibility on these platforms.12 Every quarter on the sidelines means falling further behind competitors who are already accumulating that momentum.
Different generations, different front doors
A Gen Z shopper in Chicago discovers a jacket on TikTok, taps to buy, and never opens a browser. Her mother finds the same brand through a Facebook ad, reads two reviews, and orders from her laptop. Same brand, same product, two completely different paths to purchase. Understanding these generational preferences matters because each generation’s favorite channel has its own product data requirements, and a listing built for one platform won’t perform the same way on another.
Gen Z shoppers are the most social-native buyers. More than half discover products on TikTok, with Instagram and YouTube as secondary discovery channels.13 Their social media buyer rate sits at 56%, compared to 36.5% for the general population, and they make purchases on social platforms nearly four times more often than older shoppers.14 For this generation, the shopping journey often starts and ends inside a social app without ever touching a browser or a brand’s website.
Millennials take a more fluid approach. They might spot a product in an Instagram post, research it on a laptop, and complete the purchase through a brand’s mobile app. Nearly 80% of Gen Z and Millennial shoppers integrate social media into their buying process at some stage, whether for discovery, research, or the final purchase.15 Millennials are also more skeptical of traditional advertising and tend to trust user-generated content and authentic influencer reviews over branded messaging.16
Gen X shoppers are the generation most likely to buy directly through Facebook. Among US social buyers, 62% said their most recent social purchase happened on Facebook, a figure driven largely by Gen X and older Millennials.17 Gen X consumers are tech-adaptable and deliberate, with a preference for authentic messaging over trend-driven content.18 They respond well to product information that is detailed and straightforward, with less interest in the short-form video formats that drive Gen Z engagement.
The practical takeaway for merchants is that a single-channel approach reaches one generation well and underserves the other two. Selling only through a Shopify storefront and Google Shopping leaves a brand largely invisible to Gen Z shoppers who discover products on TikTok. Meanwhile, investing heavily in TikTok content while ignoring Facebook means missing the channel where Gen X is most likely to buy. Each of these platforms requires product data formatted to its own specifications, from image dimensions and title character limits to required attribute fields and category taxonomies.
Your product data wasn’t built for this
Most product catalogs were designed for a world where desktop browsers and Google Shopping were the primary channels. The titles, images, and attribute fields in a typical feed are optimized to meet Google’s specifications and pass compliance checks on a single platform. That approach worked when the product feed had one job, but now the same catalog needs to serve mobile screens, TikTok Shop, Instagram, Facebook, Amazon, and a growing list of AI-powered discovery surfaces.
The conversion data makes the cost of this mismatch visible. Mobile shoppers convert at 2.03% compared to 3.81% on desktop, according to Contentsquare’s analysis of 90 billion sessions across 6,000 websites.19 Cart abandonment on mobile runs at roughly 85%, compared to about 70% on desktop.20 Checkout design contributes to that friction, and product information compounds it. On a phone screen, titles get truncated, descriptions lose critical detail, and images that looked sharp on a monitor shrink to unreadable thumbnails. When the catalog wasn’t built for the channels shoppers actually use, the shopper experience suffers even if the storefront itself is mobile-optimized.
Dynamic Yield, owned by Mastercard, reports mobile AOV at $153 compared to $216 on desktop, a 41% difference.21 That $63 spread across millions of transactions adds up fast. Some of that reflects browsing behavior, with people making quicker, smaller purchases on their phones, but some of it reflects product pages that don’t give shoppers enough information or confidence to add higher-priced items to their carts.
The multichannel problem makes the revenue loss worse. TikTok Shop requires different title formats, image dimensions, and category structures than Google Shopping, while Instagram and Amazon each impose their own catalog specifications.22 Consider a pair of waterproof hiking boots. Google Shopping rewards a spec-heavy title like “Men’s Waterproof Hiking Boot — Black, Size 10, Gore-Tex” with detailed attributes. TikTok Shop performs better with shorter, more conversational titles, while Instagram favors lifestyle-first descriptions that emphasize look and feel over specifications. One product listed on five channels needs five versions of its data, each optimized for that platform’s algorithms, display formats, and shopper expectations. Managing these variations manually across a growing number of channels creates exactly the kind of data inconsistency that leads to disapprovals, overselling, and lost visibility.
Three places to start
The shift to mobile and social is a lot to absorb, especially for mid-market teams running lean. You don’t need to be everywhere at once. Start with the channels that matter most to your customers and focus on getting the product data right for those first.
1. Find out where your product data breaks down. If you’re on Shopify, chances are that 70% or more of your traffic comes from mobile devices. Pull up your top-selling products on a phone and look for titles that get cut off, descriptions that lose key details, and images that shrink past the point of legibility. Then check how those same products appear on any social channels where you’re listed. Feed audit tools can automate this process across channels, flagging data quality issues and missing attributes before they cost you visibility or sales.
2. Optimize for your top channels first, then expand. Spreading a single generic feed across every available marketplace and social platform is a common trap. Each channel rewards different catalog data, from the title structure that performs best on TikTok Shop to the attribute fields that drive Google Shopping rankings. Channel-specific feed templates handle much of this formatting automatically, transforming your master catalog to meet each platform’s specifications without requiring your team to manage every variation by hand. Start with your highest-revenue channel, your fastest-growing channel, and one channel where your target audience is underserved.
3. Centralize your product data so updates happen once. When pricing, inventory, or product details change, those changes should propagate across every channel automatically. Manual updates across multiple platforms create inconsistencies that cause disapprovals, overselling, and lost trust with both platforms and shoppers. Centralized feed management solves this by maintaining a single master catalog and syndicating optimized versions to each destination. When a product sells on Amazon, inventory updates on Shopify, TikTok Shop, and Google Shopping at the same time, preventing the overselling that damages both customer trust and platform standing.
This is the first post in our Connected Commerce Growth series. Next up, we’ll tackle scaling TikTok Shop profitably and explore why Google Shopping still wins in 2026. Athos Commerce helps ecommerce brands solve the multichannel product discovery challenge with centralized feed management, channel-specific product feed optimization, and syndication to over 1,400 channels. If you want to see how your product data performs across mobile and social channels today, talk to the Athos Commerce team.
FAQs
What percentage of ecommerce traffic comes from mobile devices?
Mobile devices account for roughly 77% of all retail ecommerce traffic globally, according to data from Salesforce’s Shopping Index.23 During Shopify’s 2025 Black Friday Cyber Monday weekend, mobile accounted for 76% of traffic and 69% of orders.24 Adobe Digital Insights confirmed that 2025 was the first full year that mobile exceeded 50% of total US online spend, with mobile revenue share reaching 56.4% during the holiday season.25
Why do mobile conversion rates lag behind desktop?
Mobile shoppers convert at 2.03% compared to 3.81% on desktop, according to Contentsquare’s analysis of 90 billion sessions.33 Cart abandonment on mobile runs at roughly 85%, compared to about 70% on desktop.34 The causes include checkout friction on smaller screens and product information that renders poorly on mobile, with titles getting truncated, descriptions losing detail, and images shrinking below useful sizes.
Sources & Further Reading
- Salesforce. “Shopping Index: Ecommerce Trends & Online Shopping Statistics.” Salesforce, 2026. https://www.salesforce.com/retail/shopping-index/
- Adobe. “Adobe: Holiday Shopping Season Drove a Record $257.8 Billion Online with Consumers Embracing Generative AI Tools.” Adobe Newsroom, January 2026. https://news.adobe.com/news/2026/01/adobe-holiday-shopping-season
- Shopify. “Shopify merchants generate record-breaking $14.6 billion in Black Friday Cyber Monday sales.” Shopify News, 2025. https://www.shopify.com/news/bfcm-data-2025
- Salesforce. “Shopping Index: Ecommerce Trends & Online Shopping Statistics.” Salesforce, 2026. https://www.salesforce.com/retail/shopping-index/
- Adobe. “Adobe: Holiday Shopping Season Drove a Record $257.8 Billion Online with Consumers Embracing Generative AI Tools.” Adobe Newsroom, January 2026. https://news.adobe.com/news/2026/01/adobe-holiday-shopping-season
- Shopify. “Shopify merchants generate record-breaking $14.6 billion in Black Friday Cyber Monday sales.” Shopify News, 2025. https://www.shopify.com/news/bfcm-data-2025
- eMarketer. “US Social Commerce Forecast 2026.” eMarketer, 2026. https://www.emarketer.com/content/us-social-commerce-forecast-2026
- eMarketer. “TikTok Shop Makes Up Nearly 20% of Social Commerce in 2025.” eMarketer Press Release, 2025. https://www.emarketer.com/press-releases/tiktok-shop-makes-up-nearly-20-of-social-commerce-in-2025/
- Resourcera (citing ByteDance disclosures). “TikTok Shop Statistics (2025-2026): Global GMV & Insights.” Resourcera, 2026. https://resourcera.com/data/social/tiktok-shop-statistics/
- Marketing LTB (citing TikTok platform data). “93+ TikTok Shop Statistics 2025: GMV by Country, AOV, CR & More.” Marketing LTB, 2025. https://marketingltb.com/blog/statistics/tiktok-shop-statistics/
- Bazaarvoice. “Shopper Experience Index Vol 18.” Bazaarvoice Press Release, November 2024. https://www.bazaarvoice.com/press/bazaarvoice-shopper-experience-index-vol-18-88-of-shoppers-want-an-omnichannel-experience-a-third-of-shoppers-say-that-includes-social/
- eMarketer. “US Social Commerce Forecast 2026.” eMarketer, 2026. https://www.emarketer.com/content/us-social-commerce-forecast-2026
- Bazaarvoice. “Shopper Preference Report 2025.” Bazaarvoice, 2025. https://www.bazaarvoice.com/resources/shopper-preference-report-2025/
- eMarketer. “FAQ on Gen Z: How marketers can reach this generation in 2026.” eMarketer, 2026. https://www.emarketer.com/content/faq-on-gen-z–how-marketers-reach-this-generation-2026
- Bazaarvoice. “Shopper Preference Report 2025.” Bazaarvoice, 2025. https://www.bazaarvoice.com/resources/shopper-preference-report-2025/
- Bazaarvoice. “Shopper Preference Report 2025.” Bazaarvoice, 2025. https://www.bazaarvoice.com/resources/shopper-preference-report-2025/
- eMarketer. “US Social Commerce Forecast 2026.” eMarketer, 2026. https://www.emarketer.com/content/us-social-commerce-forecast-2026
- New Day Studio. “Generational Marketing 2025-2026: Channel Guide.” New Day Studio Blog, 2026. https://www.newdaystudio.co/blog/cross-generational-marketing-channel-rankings
- Contentsquare. “Digital Experience Benchmark Report 2025.” Contentsquare, 2025. https://contentsquare.com/press/2025-digital-experience-benchmarks/
- Baymard Institute. “50 Cart Abandonment Rate Statistics 2026.” Baymard Institute, 2026. https://baymard.com/lists/cart-abandonment-rate
- Dynamic Yield (Mastercard). “eCommerce statistics and benchmarks by industry.” Dynamic Yield XP2, 2026. https://marketing.dynamicyield.com/benchmarks/
- NextFeed. “TikTok Shop Feed Requirements Explained.” NextFeed Articles, 2026. https://www.nx-feed.com/articles/tiktok-shop-feed-requirements-explained
- Salesforce. “Shopping Index: Ecommerce Trends & Online Shopping Statistics.” Salesforce, 2026. https://www.salesforce.com/retail/shopping-index/
- Shopify. “Shopify merchants generate record-breaking $14.6 billion in Black Friday Cyber Monday sales.” Shopify News, 2025. https://www.shopify.com/news/bfcm-data-2025
- Adobe. “Adobe: Holiday Shopping Season Drove a Record $257.8 Billion Online with Consumers Embracing Generative AI Tools.” Adobe Newsroom, January 2026. https://news.adobe.com/news/2026/01/adobe-holiday-shopping-season
- eMarketer. “US Social Commerce Forecast 2026.” eMarketer, 2026. https://www.emarketer.com/content/us-social-commerce-forecast-2026
- eMarketer. “TikTok Shop Makes Up Nearly 20% of Social Commerce in 2025.” eMarketer Press Release, 2025. https://www.emarketer.com/press-releases/tiktok-shop-makes-up-nearly-20-of-social-commerce-in-2025/
- Resourcera (citing ByteDance disclosures). “TikTok Shop Statistics (2025-2026): Global GMV & Insights.” Resourcera, 2026. https://resourcera.com/data/social/tiktok-shop-statistics/
- Bazaarvoice. “Shopper Preference Report 2025.” Bazaarvoice, 2025. https://www.bazaarvoice.com/resources/shopper-preference-report-2025/
- eMarketer. “FAQ on Gen Z: How marketers can reach this generation in 2026.” eMarketer, 2026. https://www.emarketer.com/content/faq-on-gen-z–how-marketers-reach-this-generation-2026
- Bazaarvoice. “Shopper Preference Report 2025.” Bazaarvoice, 2025. https://www.bazaarvoice.com/resources/shopper-preference-report-2025/
- eMarketer. “US Social Commerce Forecast 2026.” eMarketer, 2026. https://www.emarketer.com/content/us-social-commerce-forecast-2026
- Contentsquare. “Digital Experience Benchmark Report 2025.” Contentsquare, 2025. https://contentsquare.com/press/2025-digital-experience-benchmarks/
- Baymard Institute. “50 Cart Abandonment Rate Statistics 2026.” Baymard Institute, 2026. https://baymard.com/lists/cart-abandonment-rate
- NextFeed. “TikTok Shop Feed Requirements Explained.” NextFeed Articles, 2026. https://www.nx-feed.com/articles/tiktok-shop-feed-requirements-explained
- Marketing LTB (citing TikTok platform data). “93+ TikTok Shop Statistics 2025: GMV by Country, AOV, CR & More.” Marketing LTB, 2025. https://marketingltb.com/blog/statistics/tiktok-shop-statistics/
- Bazaarvoice. “Shopper Experience Index Vol 18.” Bazaarvoice Press Release, November 2024. https://www.bazaarvoice.com/press/bazaarvoice-shopper-experience-index-vol-18-88-of-shoppers-want-an-omnichannel-experience-a-third-of-shoppers-say-that-includes-social/