At IMRG’s Weekly Data Show on August 21, Athos Commerce’s VP of Marketing, Jennifer Baron, led a fast, practical session: “When orders and revenue diverge, what works?” IMRG’s weekly lens showed fashion as the notable drag on overall performance. Excluding fashion, the market looked materially stronger week on week. This post recaps the framework and actions.
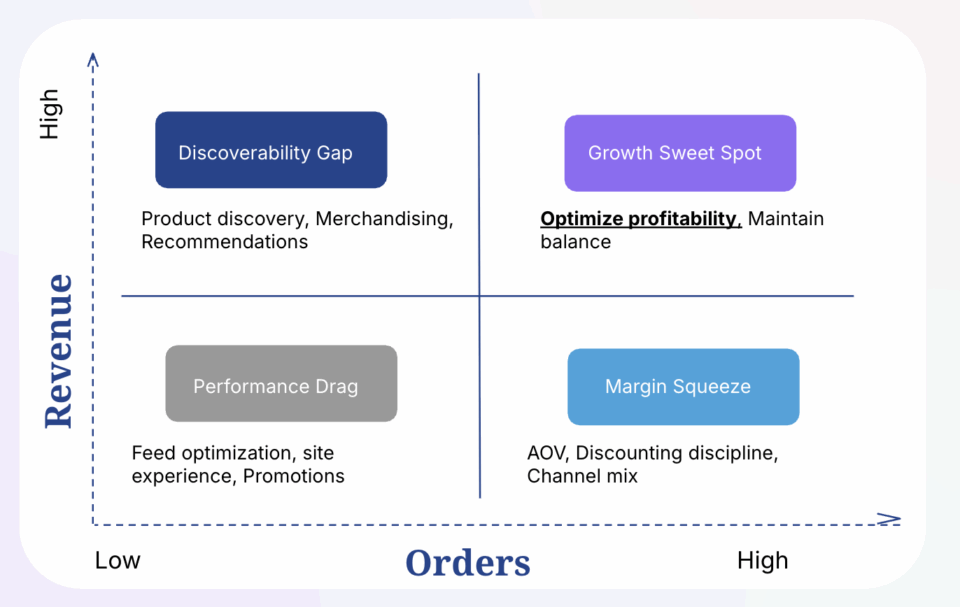
The Orders vs. Revenue matrix

Top-right: High Orders / High Revenue (“Growth sweet spot”)
What it means: Product discovery is working, mix is healthy, promotions are disciplined, and returns are under control.
What to do: Protect balance. Keep guardrails in place for margin bands, inventory exposure, and return risk. Measure contribution margin per session and return-adjusted revenue weekly. Use targeted bundles and thresholds sparingly to avoid training discount dependence.
Bottom-right: High Orders / Low Revenue (“Margin squeeze”)
What it means: Promotions or a low-value mix are inflating orders while AOV and margin lag.
Moves that work:
- Shift from blanket cuts to thresholded or audience-specific offers. Use bundles as the nudge, not the driver. US data shows deep discounting can lift traffic and orders (Prime Day online spend hit $24.1B; apparel discounts averaged ~24%). Keep the precision to protect revenue quality.
- Re-rank with profit signals such as margin band, stock position, and predicted return risk before increasing promotion depth.
- Watch mobile behavior. In the US, 53% of Prime Day sales came via mobile. This is good for volume. Use mix controls to protect revenue.
Top-left: Low Orders / High Revenue (“Discoverability gap”)
What it means: The average basket is strong, but too few shoppers find the right products.
Moves that work:
- Cut search abandonment first. Google/Harris polling ties failed on-site search to $234B in US retail losses and more than $2T globally. Fix synonyms, misspellings, budget intent (for example, “under £50,” “gift £500–£1,000”), and “no results” dead ends.
- Improve product data quality across titles, attributes, and availability, so the right SKUs appear in search engines, social, and marketplaces, and land on relevant results.
- Many journeys start on marketplaces. Around 50% of product searches begin on Amazon in the US. Weak discovery pushes shoppers there and takes margin with it.
Bottom-left: Low Orders / Low Revenue (“Performance drag”)
What it means: Fundamentals are off. Attributes are thin, feeds are messy, delivery and returns are unclear, and promotions are generic.
Moves that work:
- Fix product data first. Add size and fit details, materials, and other key attributes. Clean feeds per channel before buying more traffic.
- Remove friction. Show shipping costs earlier. Expose in-stock variants in search and category results. Offer clear alternatives when items are out of stock.
- Test one change per week. Keep what improves profit per visit.
Market signals to consider for specific regions (UK, US, APAC)
UK: IMRG’s weekly read shows orders and revenue can move out of step, with fashion often pulling down the aggregate. When leaning on promotions, monitor mix and returns closely.
US: Deal cycles are pulling heavy traffic. During July’s four-day Prime event, US online spend reached $24.1B. Apparel saw the steepest discounts at ~24%, and mobile drove ~53% of sales. This is strong for orders. Revenue needs guardrails. Across peak season, average discount rates were ~23% in the US and ~22% globally, with apparel at ~30–33%. Blanket promotions move units, not necessarily profit.
APAC: Social and marketplace journeys are standard. Fifty-six percent of APAC consumers have bought directly via social. In Southeast Asia, video commerce accounts for ~20% of e-commerce GMV, and regional e-commerce GMV grew ~15% year over year in 2024. The focus is shifting from vouchers to conversion quality and profitability. In ANZ, shoppers remain value-conscious and use multiple touchpoints before purchase.
How to move toward the “sweet spot” in 30 days
- Place a bet on discovery quality. Reduce failed searches and dead ends. Enrich attributes. Understand budget intent. This cuts bounce and raises basket quality without deeper discounts.
- Make product data feeds do real work. Clean, channel-specific feeds reduce wasted spend and lift paid performance. This pays off on-site.
- Rebalance promotions. Replace site-wide cuts with thresholds, bundles, and audience targeting. Keep apparel discounts in check. US patterns show how quickly they widen.
- Measure what matters. Track contribution margin per session, return-adjusted revenue, and discount dependency.
- Test weekly. Make small, visible changes to discovery, feeds, and promotion structure. Keep the winners.
Watch the session
Jennifer Baron’s talk was part of IMRG’s Weekly Data Show: “Metric deep dive: Orders vs. Revenue.” Check the event page for details and future sessions.


